Measuring manager performance in fantasy football
Introduction
If you’ve played (American) fantasy football, you’ve probably felt that you have been unlucky and unjustly lost matches at some point. “I had the second most points of any team in my league this week, and I only lost because I happened to play the team that scored the most points!” If you’re like me, the first thing that we do is go to our league standings and look to see how we stack up against the rest of the teams in points for and against. If you’ve scored the third most points but your current placing is eighth because you’ve happened to have the most points scored against you, then of course you have a right to feel slighted.
But are there other ways you can go about justifying your dissatisfaction? I can think of at least three:
- All-play record: What would your position in the league table be if every team played all other teams in head-to-head matchups every week? How much did your schedule impact your record?
- Actual points scored compared to projection: Are you scoring less than your projected total? Is your team under-performing more than other teams compared to their projected scores?
- Points “left on the bench”: How many points could you have had if you had started the best possible lineup (with the benefit of hindsight)?
In this post I’ll look at each of these concepts for my own fantasy football league. Evaluating how actual scores and placings may have been impacted by schedule, projections, and lineup choices should help us reason more tangibly about really contributes to “luck”.
Analysis and Results
The data comes from the 2018 - 2023 seasons of my primary fantasy football league, hosted on ESPN.1 We’ve had different rule sets and schedule formats (i.e. playoffs started in week 14 prior to the 2021 season in this league), but for the most part, measures of performance should be mostly agnostic to this.
Data was scraped with the {ffscrapr} package maintained by Tan Ho.
All-play records
I felt like I was particularly unlucky with my schedule this past year, and indeed this bears out in the numbers.2 Juan and Drake were also very unfortunate.
| 2023 All-Play Records | |||||||
|---|---|---|---|---|---|---|---|
| Tony was the most unlucky in the league this past season. | |||||||
| Team | Actual | All Play | Win % | Δ | |||
| W | L | W | L | Actual | All Play | ||
| Tony | 4 | 10 | 56 | 70 | 29% | 44% | −16% |
| Juan | 6 | 8 | 73 | 53 | 43% | 58% | −15% |
| Drake | 4 | 10 | 55 | 71 | 29% | 44% | −15% |
| Brandon | 6 | 8 | 60 | 66 | 43% | 48% | −5% |
| Andrew L. | 7 | 7 | 63 | 63 | 50% | 50% | 0% |
| Enrique | 9 | 5 | 76 | 50 | 64% | 60% | 4% |
| Alan | 7 | 7 | 55 | 71 | 50% | 44% | 6% |
| Andrew E. | 9 | 5 | 72 | 54 | 64% | 57% | 7% |
| Luis | 8 | 6 | 57 | 69 | 57% | 45% | 12% |
| Manny | 10 | 4 | 63 | 63 | 71% | 50% | 21% |
A 16% difference between my actual record and my all-play record feels non-trivial. In fact, in comparing that level of under-performance to the prior seasons (some of which we played with a “superflex”, contributing to more variance), I find that there were only 6 less fortunate outcomes, including a -29% difference for myself in 2020!
| Actual Win % - All Play Win % | |||||||
|---|---|---|---|---|---|---|---|
| Juan and Tony have had the most unfair schedules since 2018. | |||||||
| Team | 2018 | 2019 | 2020 | 2021 | 2022 | 2023 | Total |
| Juan | −12% | 15% | −4% | −25% | 7% | −15% | −6% |
| Tony | 2% | 6% | −29% | −5% | 5% | −16% | −6% |
| Enrique | 6% | −19% | −17% | −2% | 6% | 4% | −3% |
| Brandon | −2% | −9% | 6% | −11% | 3% | −5% | −3% |
| Drake | 2% | 6% | 8% | 12% | −4% | −15% | 1% |
| Alan | −14% | 20% | 6% | 6% | −15% | 6% | 1% |
| Luis | 17% | −14% | 13% | 3% | −20% | 12% | 2% |
| Manny | 4% | 3% | 1% | −2% | −13% | 21% | 2% |
| Andrew E. | 10% | −21% | 12% | 13% | 10% | 7% | 6% |
| Andrew L. | −13% | 12% | 3% | 11% | 21% | 0% | 6% |
Andrew E. and Andrew L. have been fairly fortunate, only facing 1 season in the past 6 where they ended up with a record that was worse than their all-play records.
The top and bottom 2.5th percentiles of season-long actual win % minus all play win % are about ±22%. This translates to about ±3 wins in leagues with a 14-game regular season. So the “back-of-the-napkin” takeaway here is that you could be winning or losing 3 more games due to your schedule, in the most extreme cases.
Overall, it’s interesting to see that the under- and over-performance doesn’t quite level out even over the course of 6 seasons. Surely we’d see this even out over more and more seasons, but it’s noteworthy that even 6 seasons may not be sufficient to achieve long-run schedule schedule equality.
Actual vs. projected points
Another way to look at whether a team was “lucky” or not is to compare the points that they scored versus what they were projected to score. 3 Further, we should look to see whether one’s opponents are scoring more than they’re projected to score, as this represents another source of variance in scoring. In total, the sum of the differences between one’s own actual and projected scores and the difference with the opponents’ actual and projected scores presents another way of measuring misfortune.4
| 2023 Avg. Weekly Actual - Projected Points | |||
|---|---|---|---|
| Brandon was the most misfortunate with performance compared to projection this past season. |
|||
| Team | Team | Opponent | Team - Opponent |
| Brandon | −11.1 | 4.7 | −15.8 |
| Drake | −5.7 | 6.4 | −12.1 |
| Tony | −2.8 | 8.2 | −11.0 |
| Juan | 2.0 | 7.0 | −5.0 |
| Alan | −1.2 | −2.1 | 0.9 |
| Andrew L. | 1.3 | −1.5 | 2.8 |
| Luis | −2.2 | −8.2 | 6.0 |
| Enrique | 3.0 | −6.4 | 9.4 |
| Manny | −3.5 | −14.7 | 11.2 |
| Andrew E. | 5.2 | −8.4 | 13.6 |
| Avg. Weekly Actual - Projected Points Minus Opponent's Actual - Projected Points |
||||||
|---|---|---|---|---|---|---|
| Drake has under-performed projections the most on average since 2018. | ||||||
| Team | 2019 | 2020 | 2021 | 2022 | 2023 | Total |
| Drake | −13.2 | 5.0 | −5.8 | −0.3 | −12.1 | −5.4 |
| Brandon | −14.3 | 2.1 | 7.0 | −4.2 | −15.8 | −5.0 |
| Juan | 3.5 | −17.3 | −6.5 | 6.9 | −5.0 | −3.5 |
| Luis | −8.3 | −13.8 | 5.5 | −5.5 | 6.0 | −2.8 |
| Andrew E. | −2.1 | −8.1 | −7.5 | 2.1 | 13.6 | −0.1 |
| Enrique | 5.0 | 1.6 | −2.5 | −0.8 | 9.4 | 2.5 |
| Tony | 17.7 | 1.7 | 5.3 | 1.5 | −11.0 | 2.6 |
| Manny | −1.7 | −0.5 | −0.7 | 5.6 | 11.2 | 3.0 |
| Andrew L. | 3.3 | 21.6 | −4.0 | −3.0 | 2.8 | 3.6 |
| Alan | 10.1 | 7.7 | 9.1 | −2.3 | 0.9 | 4.9 |
| 2018 season excluded due to miscalibrated projected points. | ||||||
Observations:
- I benefited from the second most fortunate season in 2019. I averaged 13.0 points per game above my projected score, and my opponents scored 4.7 less than their projected scores, adding up to +17.7.
- Drake has under-performed and Alan has over-performed in 4 of the past 5 seasons. Interestingly, I have also over-performed in 4 of the past 5 seasons, but was fairly unfortunate this past season.
- The variance in weekly performance against expectation (as defined by projected points) is not directly represented by this table, which shows averages. The standard deviation of the weekly difference in the actual points minus projected points for both teams in a matchup is about 32.5!
Lost Opportunity
How many points did teams “leave on the bench”? This is not something managers typically think about when looking to see how unlucky they might have been (partially because it’s not the easiest thing to calculate), but it’s worth looking at, as it gives us some sense of who is best at minimizing their own downside (by starting the best players).5
| 2023 Avg. Weekly "Lost Opportunity" with Sub-Optimal Starter Choices |
|||
|---|---|---|---|
| Brandon lost out on the most points this season by not starting bench players that scored more than his starters. |
|||
| Team | # of sub-optimal starters |
Score improvement with best lineup |
League avg. score improvement - score improvement |
| Brandon | 2.6 | 27.7 | −7.8 |
| Andrew E. | 2.3 | 24.1 | −4.2 |
| Juan | 2.8 | 22.3 | −2.4 |
| Manny | 2.6 | 22.0 | −2.1 |
| Alan | 2.5 | 21.9 | −2.0 |
| Tony | 2.3 | 18.8 | 1.1 |
| Andrew L. | 2.0 | 17.8 | 2.1 |
| Luis | 1.9 | 16.9 | 3.0 |
| Drake | 1.9 | 16.2 | 3.7 |
| Enrique | 1.9 | 11.4 | 8.5 |
The magnitude of the points will vary by league, according to the league’s rules for roster slots and points. If your league is anything like mine, then you can expect to lose out on about 20 points due to about 2 sub-optimal starting roster choices each week.
Now, looking at the “lost opportunity” points compared to the league average for the past 6 seasons, we see that things tend to average out close to zero.
| "Lost Opportunity" Points with Sub-Optimal Starter Choices | |||||||
|---|---|---|---|---|---|---|---|
| Over several seasons, "lost opportunity" points level out. | |||||||
| Team | 2018 | 2019 | 2020 | 2021 | 2022 | 2023 | Total |
| Enrique | 8.1 | 6.7 | −0.6 | 7.3 | −3.8 | 8.5 | 4.3 |
| Drake | 4.4 | −2.5 | 12.4 | −4.1 | 9.1 | 3.7 | 3.8 |
| Juan | 3.8 | 2.8 | 2.8 | 3.6 | 0.4 | −2.4 | 1.7 |
| Alan | −8.4 | 3.1 | −2.4 | −0.5 | 9.8 | −2.0 | 0.1 |
| Andrew L. | −13.9 | −1.2 | 5.7 | 3.1 | 1.9 | 2.1 | −0.2 |
| Brandon | 4.2 | −5.6 | −8.4 | 15.0 | −1.4 | −7.8 | −0.5 |
| Luis | −3.7 | 2.5 | −5.2 | −11.4 | 8.1 | 3.0 | −1.0 |
| Tony | −4.1 | −4.5 | −4.5 | 2.8 | −3.0 | 1.1 | −1.8 |
| Manny | 5.4 | 4.0 | −0.5 | −11.8 | −6.6 | −2.1 | −2.3 |
| Andrew E. | 4.3 | −5.3 | 0.7 | −4.0 | −14.5 | −4.2 | −4.1 |
| Values represent league average "lost opportunity" minus team's "lost opportunity". | |||||||
Notes:
- The weighted average lost opportunity points compared to the league average only varies by about ±4 points in the extremes. We’ll likely see that range decrease as more seasons are played, as there seems to be a lot of “noise” here.
- Juan is the only team to perform better than the league average in 5 seasons. The rest of the teams had lost opportunity points greater than the league average in either 2, 3, or 4 seasons.
Discussion
To overcome the variance that comes with fantasy football, some leagues play with a “median scoring” format. In this structure, you earn a win or loss with your head-to-head matchup, as usual, but can earn another win every week if you score more than the median team score for the week. This has the effect of reducing “luck” while still allowing for some of the randomness with which most players have developed a love-hate relationship.
If we applied this scoring format to my league, here’s how the placements would have changed over the past 6 years.
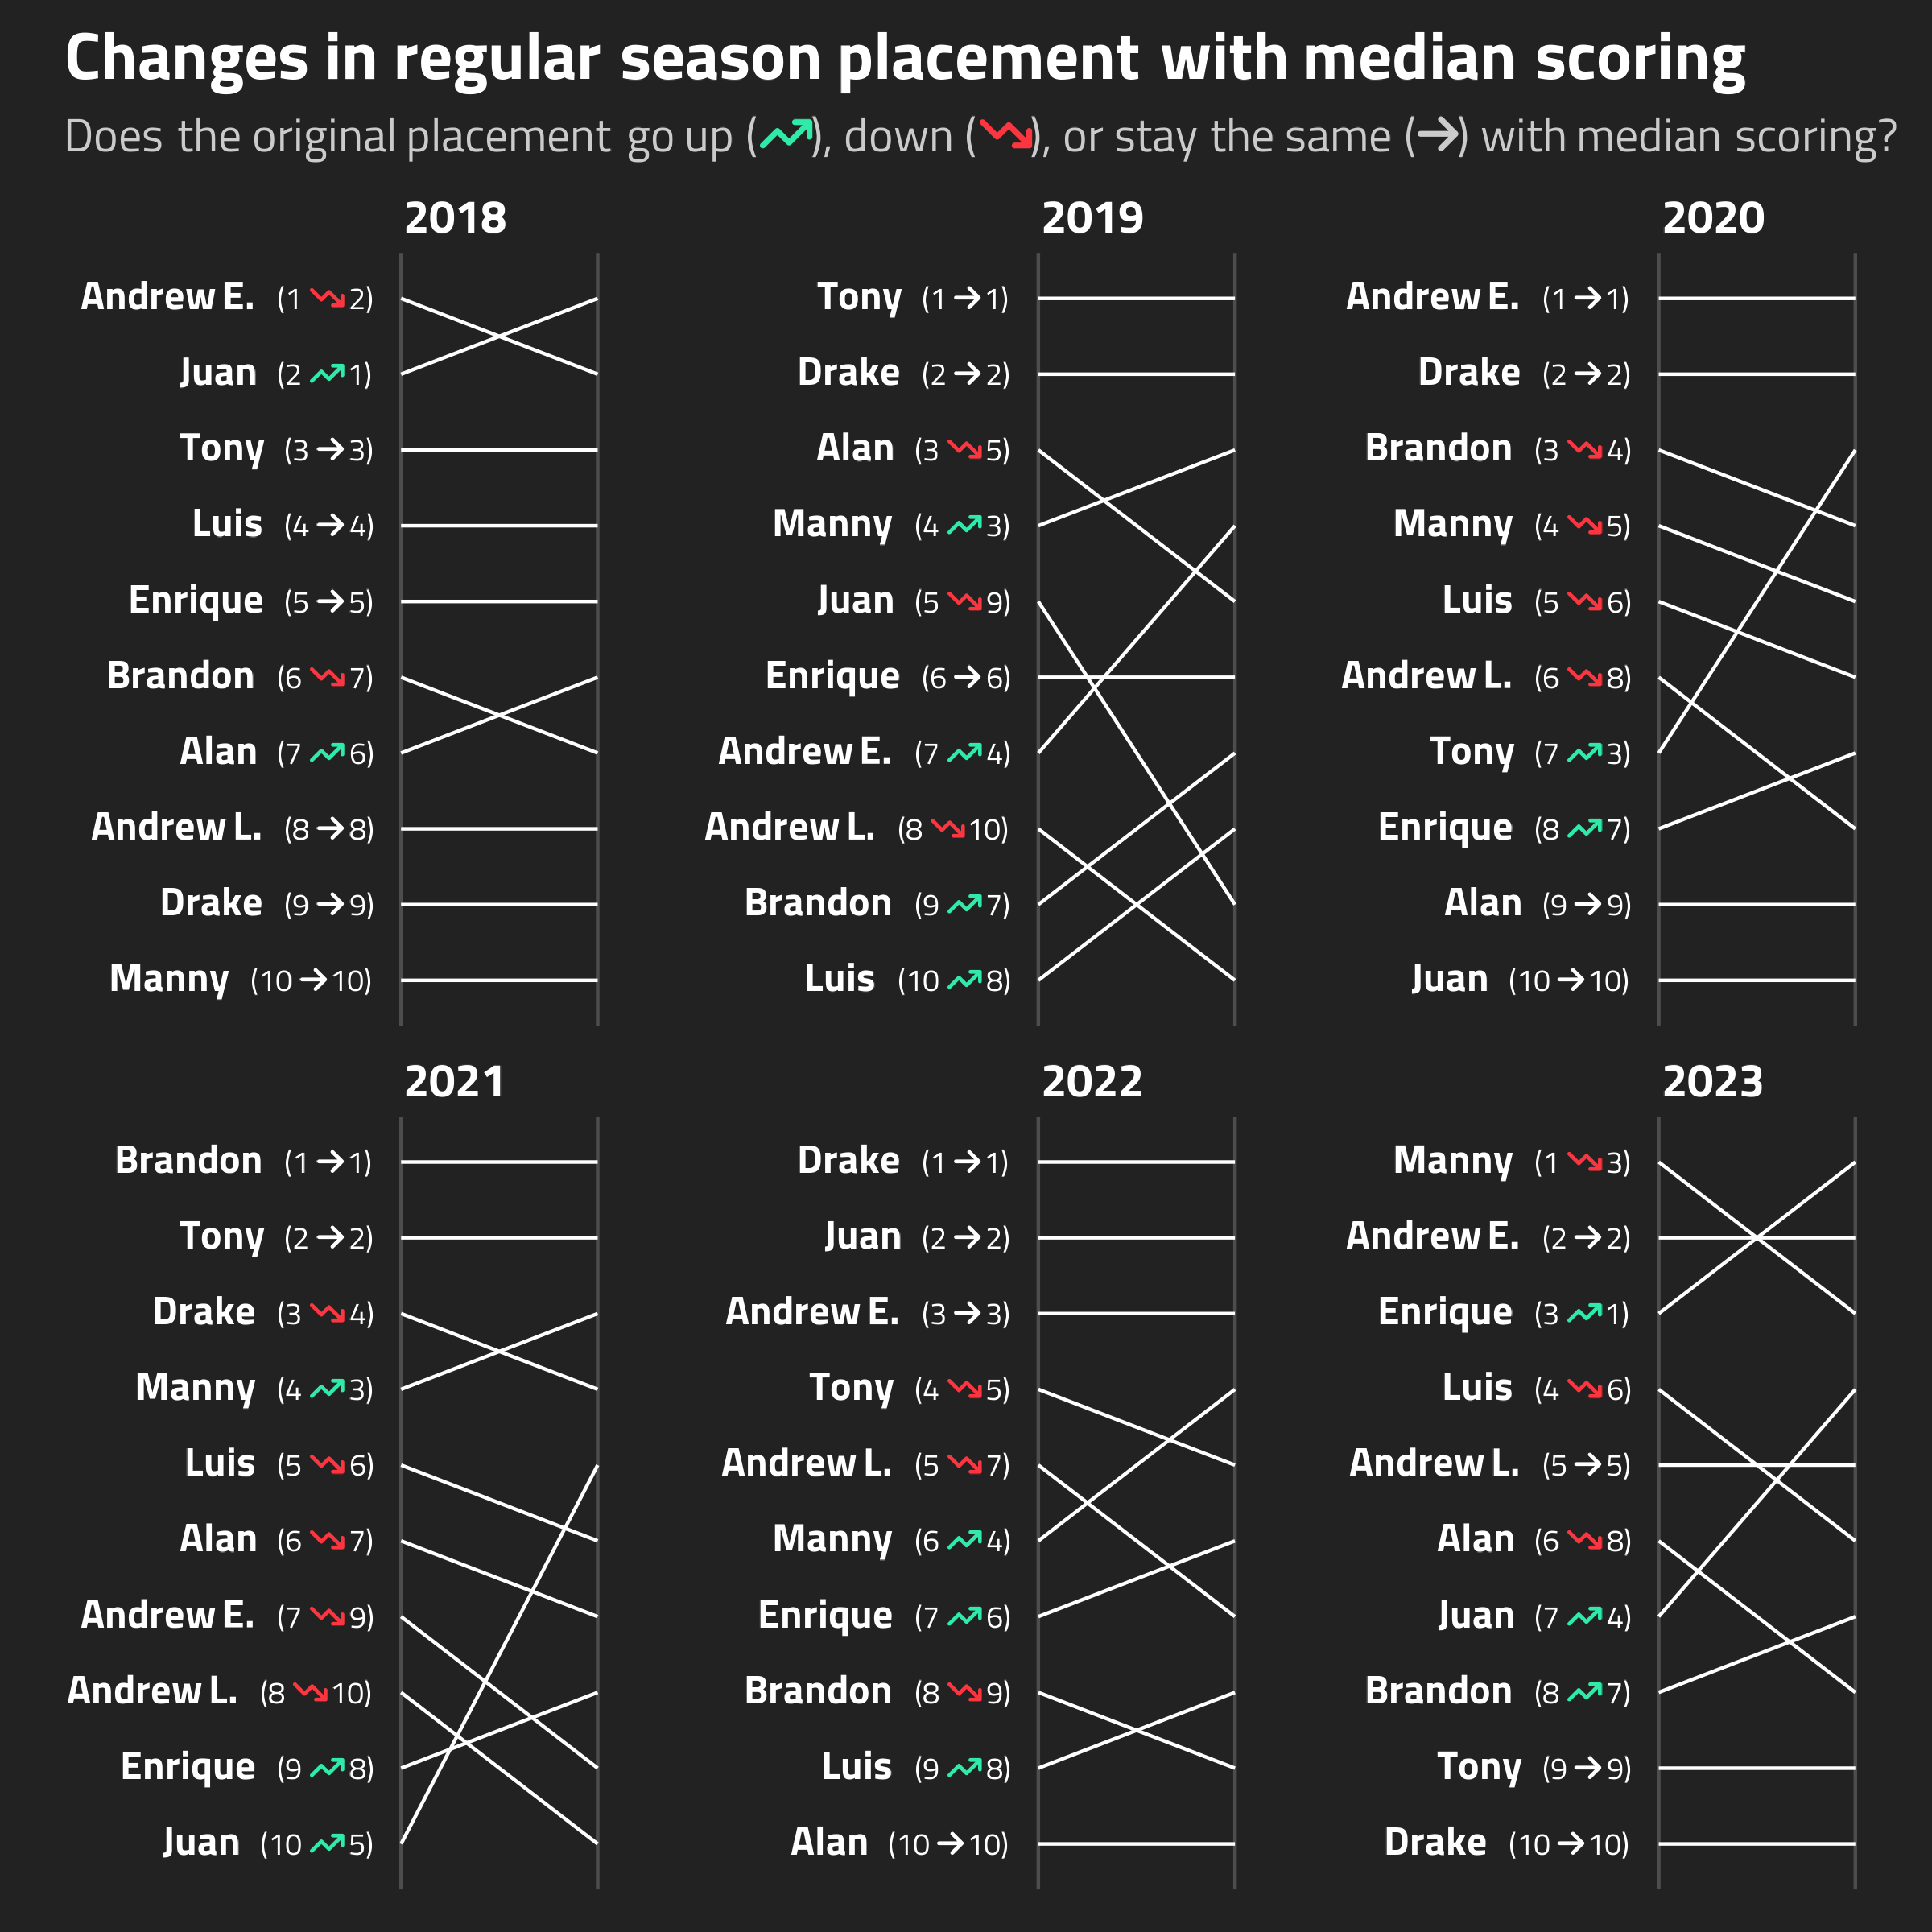
And here’s a tabular summary. (Total placement Δ represents the sum of placement changes. changes is either 1 or 0 for each season, depending on whether the placement for the team changed in a positive or negative manner.)
| Team | Total placement Δ | Positive changes | Negative changes |
|---|---|---|---|
| Enrique | 5 | 4 | 0 |
| Juan | 5 | 3 | 1 |
| Tony | 3 | 1 | 1 |
| Manny | 1 | 3 | 2 |
| Andrew E. | 0 | 1 | 2 |
| Brandon | 0 | 2 | 3 |
| Drake | -1 | 0 | 1 |
| Luis | -1 | 2 | 3 |
| Alan | -4 | 1 | 3 |
| Andrew L. | -8 | 0 | 4 |
Some observations:
- Enrique would have benefited the most–Enrique would have moved up the rankings in 4 out of the 6 seasons (and not changed in the other 2 seasons), for a total sum of +5 placements.
- On the other end of the spectrum, Andrew L. would have placed worse in 4 of the 6 seasons with the median scoring system, for a total ranking change of -8.
| Season | Teams dropping out of Top 4 | Teams rising out of Bottom 4 |
|---|---|---|
| 2018 | 0 | 0 |
| 2019 | 1 | 1 |
| 2020 | 1 | 1 |
| 2021 | 0 | 1 |
| 2022 | 1 | 1 |
| 2023 | 1 | 1 |
Given the high importance of not finishing in the bottom 4–to avoid being in the loser’s consolation playoffs and getting last place–it’s notable that 1 team would have moved out of the bottom 4 every season with the median scoring system, with the exception of 2018.
Conclusion
Looking at how the median scoring system would benefit me personally–I would never finish bottom 4 and be at risk for our last-place penalty–I think my personal takeaway is that I should push for a median scoring format in the future. There’s still going to be variance with outcomes–due to scheduling, under-performance compared to projection, and sub-optimal lineup choices–but the more deserving teams (like my own) are less likely to get a short end of the stick.
Footnotes
Just based on my own league’s numbers, it seems that ESPN improved their projections after the 2018 season, and are now fairly well calibrated, i.e. on average the error is close to 0.↩︎
For those looking to calculate this kind of table for themselves, “The Fantasy Football Hub” has a nice calculator, plus some extra goodies, e.g. “What would my record have been if I had league member X’s schedule?”.↩︎
In most cases, I’d assume that a negative difference between actual and projected scores reflects misfortune (e.g. injury, unexpected lack of playing time), although one can argue that it reflects poor management by the user, i.e. “You should have known not to start that running back against the best rushing defense!”. However, projected points should theoretically capture matchup difficulty, so this seems like a weak argument in general.↩︎
I would generally expect this measure to be correlated with the rankings of teams by actual win % minus all-play win %, assuming the projected scores are reasonably well-calibrated.↩︎
These numbers are biased by the quality of the players on a team’s roster. If a team has a lot of injured players, then they’re less likely to start sub-optimal players. Further, if they have a lot of players that just don’t tend to get a lot of points (e.g. third string WRs), then they may appear to be starting players optimally more often, simply because they don’t have great replacement-level players.↩︎