Measuring Shooting Overperformance in Soccer

r
soccer
Using empirical Bayes and the Gamma-Poisson conjugate pair
Author

Tony ElHabr

Published

August 28, 2023

Modified

April 26, 2024

Updates

Wording in this post was updated after the original posting. Originally an outperformance ratio greater than 1 was mistakenly called “underperforming”, and a ratio less than 1 was mistakenly called “overperforming”. The wording has been fixed.

Introduction

This blog post is my attempt to replicate the results in Laurie Shaw’s 2018 blog post “Exceeding Expected Goals”. Specifically, I want to shed light on how to implement Gamma-Poisson empirical Bayes (EB) estimation. If you don’t care at all about the theory behind EB and its application to this context, then go ahead and skip ahead to the “Implementation” section.

What Is Empirical Bayes (EB) estimation?

Empirical Bayes (EB) estimation. Wow, just typing that out makes me feel smart. But what is it, really? In short, I’d describe it as a mix of Bayesian and Frequentist inference. We lean into the observed frequencies of the data (Frequentist) while simultaneously refining our initial data assumptions through Bayesian updating. In practice, one might use EB as a (relatively) simple alternative to a full Bayesian analysis, which can feel daunting.

In regular Bayesian analysis, you start with your initial “guess” (prior distribution) about something, and as you gather data, you tweak that “guess” using Bayes’ theorem to get a final view (posterior distribution). We combine what we thought about the data beforehand with how likely the data matches (likelihood).

Empirical Bayes puts a twist on this. Instead of having a prior guess, you figure out that initial guess from the same data you’re analyzing. This can make things simpler, especially when you’re dealing with tons of guesses but not much initial info.

A canonical example of EB estimation (Beta-Binomial)

David Robinson wrote a wonderful blog post about empirical Bayes estimation for estimating batting averages in baseball, notably “shrinking” the battering averages of those with relatively few at bats closer to some “prior” estimate derived from a choice of hyperparameters. For context, batting average, \(BA\), is defined as a player’s count of hits, \(H\), divided by the count of their at bats, \(AB\).

\[ BA = \frac{H}{AB} \tag{1}\]

Note

I’d David’s post must read material before going through this blog post.

In his post, David uses a Beta prior and a binomial posterior together, i.e. a Beta-binomial Bayesian model)12, since this tandem is suitable for proportions and probabilities. The gist of his approach: we add some fixed number of hits, \(\alpha_0\), and a fixed number of at bats, \(\beta_0\), to the numerator and denominator of the battering average equation as so.

\[ \frac{H + \alpha_0}{AB + \alpha_0 + \beta_0} \tag{2}\]

Specifically, the “prior” estimate of batting average is found by isolating the \(\alpha_0\) and \(\beta_0\) elements:

\[ \frac{\alpha_0}{\alpha_0 + \beta_0} \tag{3}\]

If, for example, alpha0 = 70 and beta0 = 163, then the prior estimate of batting average is effectively 70 / (70 + 163) = 0.3. Note that alpha0 and beta0 are learned from the data using maximum likelihood estimation (MLE), although other approaches, such as “method of moments” could be used. (Heck, you could even defensibly choose these “hyperparameters” yourself, without any fancy statistics, if you feel that you have enough knowledge of the data.)

Gamma-Poisson EB estimation

Now, for my replication of Shaw’s analysis, we’re going to be focusing on the ratio of a player’s goals, \(G\), divided by their expected goals), \(xG\), summed up over a fixed period. Shaw refers to this as “outperformance” \(O\) for a player \(p\):

\[ O_p = \frac{G_p}{xG_p} \tag{4}\]

While one might be tempted to use Beta-Binomial EB since this setup seems similar to batting average in Equation 1, Shaw used a Gamma-Poisson EB adjustment, and justifiably so. Gamma-Poisson makes more sense when the underlying data consists of counts and what you’re trying to estimate is a rate or ratio, not a proportion bounded between 0 and 1. Note that a \(O_p\) ratio of 1 indicates that a player is scoring as many goals as expected; a ratio greater than 1 indicates overperformance; and a ratio less than 1 indicates underperformance. On, the other hand, batting average is bounded between 0 and 1.

Now, despite the naming of conjugate prior pairs–e.g. “Beta-Binomial” and “Gamma-Poisson”, where the prior distribution is represented by the first distribution and the likelihood distribution is indicated by the second–let’s not forget that there is a third distribution to be noted: the posterior. In the case of the Gamma-Poisson model, the unnormalized posterior distribution of the “kernel” (i.e. the prior and likelihood pair) is a Gamma distribution. (This is always the case with Gamma-Prior kernels.)

In practice, this means that we’ll be using the Gamma distribution for both estimating hyperparameters and posterior sampling. Perhaps surprising to the reader, you won’t need any Poisson functions in the code implementation. Rather, the Poisson distribution is pertinent to implementation only to the extent that the Gamma distribution happens to be the most reasonable distribution to pair with it.

I’ve woefully explained away a lot of details here, but hopefully this all makes sense to those with a basic understanding of the Gamma and Poisson distributions themselves.

Implementation

Ok, so with all of that context provided, now let’s do the replication of Shaw’s findings.

Data

First, let’s pull the data we’ll need–2016/17 and 2017/18 English Premier League goals and expected goals (xG) by player. I’m using understat since it is a reliable source of data3 and is easy to retrieve data from via the {worldfootballR} package.4

Note that Shaw used data from a provider, Stratagem, that no long provides data, as far as I can tell. For at least this reason, I won’t be able to exactly match his reason.5

Code
## data wrangling
library(worldfootballR)
library(dplyr)
library(tibble)

## distribution fitting and wrangling
library(MASS, include.only = 'fitdistr') ## to avoid `select` name conflict with dplyr
library(withr)
library(purrr)
library(tidyr)

raw_shots <- worldfootballR::load_understat_league_shots(league = 'EPL')
shots <- raw_shots |> 
  tibble::as_tibble() |> 
  dplyr::filter(
    season %in% c(2016L, 2017L), ## 2016/17 and 2017/18 seasons
    situation != 'DirectFreeKick' ## "excluding free-kicks" in the blog post
  ) |> 
  dplyr::arrange(id) |> 
  dplyr::transmute(
    id,
    player,
    xg = x_g,
    g = as.integer(result == 'Goal')
  )
shots
#> # A tibble: 19,047 × 4
#>        id player               xg     g
#>     <dbl> <chr>             <dbl> <int>
#>  1 112088 Aaron Ramsey    0.0695      0
#>  2 112089 Nathaniel Clyne 0.0293      0
#>  3 112090 Aaron Ramsey    0.00734     0
#>  4 112091 Roberto Firmino 0.0856      0
#>  5 112092 Roberto Firmino 0.0441      0
#>  6 112093 Sadio Mané      0.0607      0
#>  7 112094 Ragnar Klavan   0.0742      0
#>  8 112095 Theo Walcott    0.761       0
#>  9 112096 Theo Walcott    0.0721      1
#> 10 112097 Roberto Firmino 0.0241      0
#> # ℹ 19,037 more rows

Above was pulling in every record of shots, with 1 row per shot. Now we aggregate to the player level, such that we have one row per player.

Code
shots_by_player <- shots |> 
  dplyr::group_by(player) |> 
  dplyr::summarize(
    shots = dplyr::n(),
    dplyr::across(c(g, xg), sum)
  ) |> 
  dplyr::ungroup() |> 
  dplyr::mutate(raw_ratio = g / xg) |> 
  dplyr::arrange(dplyr::desc(shots))
shots_by_player
#> # A tibble: 588 × 5
#>    player            shots     g    xg raw_ratio
#>    <chr>             <int> <int> <dbl>     <dbl>
#>  1 Harry Kane          293    59  46.7     1.26 
#>  2 Sergio Agüero       234    41  41.2     0.994
#>  3 Christian Eriksen   229    18  16.1     1.12 
#>  4 Alexis Sánchez      217    33  29.1     1.13 
#>  5 Romelu Lukaku       196    41  32.1     1.28 
#>  6 Roberto Firmino     184    26  21.1     1.23 
#>  7 Kevin De Bruyne     179    14  12.2     1.15 
#>  8 Salomón Rondón      171    15  16.2     0.924
#>  9 Paul Pogba          168    11  14.3     0.768
#> 10 Christian Benteke   164    18  28.5     0.631
#> # ℹ 578 more rows

EB step 1: estimate prior hyperparameters

Next, we estimate hyperparameters for our prior gamma distribution using MLE. (With R’s dgamma, the hyperparameters are shape and rate6). I subset the data down to players having taken at least 50 shots for estimating these hyperparameters, as this is what Shaw does. In general, you’d want to filter your data here to records that provide good “signal”, and, therefore, will provide reliable estimates of your hyperparameters.7

Code
prior_shots_by_player <- dplyr::filter(
  shots_by_player, 
  shots >= 50,
  g > 0 ## prevent error with fitting prior distribution
)

prior_distr <- MASS::fitdistr(
  prior_shots_by_player$raw_ratio,
  dgamma,
  start = list(shape = 1, rate = 1)
)
prior_shape <- prior_distr$estimate[1]
prior_rate <- prior_distr$estimate[2]
list(prior_shape = round(prior_shape, 2), prior_rate = round(prior_rate, 2))
#> $prior_shape
#> shape 
#>  9.39 
#> 
#> $prior_rate
#> rate 
#> 8.93

EB step 2: Use prior distribution to sample the posterior

Now we use our prior distribution’s hyperparameters to update all players’ \(O\) ratio based on their individual volume of evidence, i.e. their goals and xG.

simulate_gamma_posterior <- function(
    successes, 
    trials, 
    prior_shape, 
    prior_rate, 
    n_sims = 10000,
    seed = 42
) {
  posterior_shape <- prior_shape + successes
  posterior_rate <- prior_rate + trials
  withr::local_seed(seed)
  posterior_sample <- rgamma(n = n_sims, shape = posterior_shape, rate = posterior_rate)
  list(
    mean = mean(posterior_sample),
    sd = sd(posterior_sample)
  )
}

shots_by_player$adj_ratio <- purrr::map2(
  shots_by_player$g, shots_by_player$xg,
  function(g, xg) {
    simulate_gamma_posterior(
      successes = g,
      trials = xg,
      prior_shape = prior_shape,
      prior_rate = prior_rate
    )
  }
)

adj_ratio_by_player <- shots_by_player |> 
  tidyr::unnest_wider(
    adj_ratio, 
    names_sep = '_'
  ) |> 
  dplyr::arrange(dplyr::desc(adj_ratio_mean))
adj_ratio_by_player
#> # A tibble: 588 × 7
#>    player            shots     g    xg raw_ratio adj_ratio_mean adj_ratio_sd
#>    <chr>             <int> <int> <dbl>     <dbl>          <dbl>        <dbl>
#>  1 Fernando Llorente    57    16  9.19      1.74           1.40        0.281
#>  2 Philippe Coutinho   160    20 12.5       1.60           1.37        0.256
#>  3 Shkodran Mustafi     37     5  1.82      2.75           1.34        0.357
#>  4 Pascal Groß          43     7  3.34      2.10           1.34        0.334
#>  5 Ryan Fraser          55     8  4.09      1.95           1.34        0.324
#>  6 Eden Hazard         148    28 19.2       1.45           1.33        0.219
#>  7 James McArthur       53    10  5.93      1.69           1.31        0.299
#>  8 Charlie Daniels      39     5  2.18      2.30           1.30        0.346
#>  9 Xherdan Shaqiri     117    12  7.61      1.58           1.29        0.282
#> 10 Andy Carroll         67    10  6.09      1.64           1.29        0.296
#> # ℹ 578 more rows

Finally, let’s plot our results, plotting our adjusted mean estimates of \(O_p\), ±1 standard deviation about the adjusted mean.8 As noted earlier, we won’t achieve exactly the same results as Shaw due to using a different set of xG values, but evidently we’ve achieved results reasonably close to his.

Code
library(ggplot2)
library(forcats)
library(ggh4x)
library(magick)

shaw_players <- c(
  'Eden Hazard' = 'E. Hazard',
  'Mohamed Salah' = 'Mohamed Salah',
  'Son Heung-Min' = 'Heung-Min Son',
  'Joshua King' = 'J. King',
  'Romelu Lukaku' = 'R. Lukaku',
  'Harry Kane' = 'H. Kane',
  'Sadio Mané' = 'S. Mane',
  'Dele Alli' = 'D. Ali',
  'Riyad Mahrez' = 'R. Mahrez',
  'Christian Eriksen' = 'C. Eriksen',
  'Pedro' = 'Pedro',
  'Alexis Sánchez' = 'A. Sanchez',
  'Roberto Firmino' = 'Roberto Firmino',
  'Jamie Vardy' = 'J. Vardy',
  'Xherdan Shaqiri' = 'X. Shaqiri',
  'Wilfried Zaha' = 'W. Zaha',
  'Nathan Redmond' = 'N. Redmond',
  'Gylfi Sigurdsson' = 'G. Sigurdsson',
  'Kevin De Bruyne' = 'K. De Bruyne',
  'Andros Townsend' = 'A. Townsend',
  'Sergio Agüero' = 'S. Aguero',
  'Marcus Rashford' = 'M. Rashford',
  'Jermain Defoe' = 'J. Defoe',
  'Raheem Sterling' = 'R. Sterling',
  'Marko Arnautovic' = 'M. Arnautovic',
  'Paul Pogba' = 'P. Pogba',
  'Salomón Rondón' = 'S. Rondon',
  'Christian Benteke' = 'C. Benteke'
)

ordinal_adj_ratio_by_player <- adj_ratio_by_player |>
  dplyr::filter(
    player %in% names(shaw_players)
  ) |> 
  dplyr::mutate(
    player = forcats::fct_reorder(shaw_players[player], adj_ratio_mean)
  )

adj_ratio_plot <- ordinal_adj_ratio_by_player |>
  ggplot2::ggplot() +
  ggplot2::aes(y = player) +
  ggplot2::geom_errorbarh(
    aes(
      xmin = adj_ratio_mean - adj_ratio_sd,
      xmax = adj_ratio_mean + adj_ratio_sd
    ),
    color = 'blue',
    linewidth = 0.1,
    height = 0.3
  ) +
  ggplot2::geom_point(
    ggplot2::aes(x = adj_ratio_mean),
    shape = 23,
    size = 0.75,
    stroke = 0.15,
    fill = 'red',
    color = 'black'
  ) +
  ggplot2::geom_vline(
    ggplot2::aes(xintercept = 1), 
    linewidth = 0.1, 
    linetype = 2
  ) +
  ## add duplicate axis for ticks: https://stackoverflow.com/questions/56247205/r-ggplot2-add-ticks-on-top-and-right-sides-of-all-facets
  ggplot2::scale_x_continuous(sec.axis = ggplot2::dup_axis()) +
  ## ggplot2 doesn't support duplicated and creatinga  second axis for discrete variables:
  ##   https://github.com/tidyverse/ggplot2/issues/3171.
  ##   using ggh4x is a workaround.
  ggplot2::guides(
    y.sec = ggh4x::guide_axis_manual(
      breaks = ordinal_adj_ratio_by_player$player,
      labels = ordinal_adj_ratio_by_player$player
    )
  ) +
  ggplot2::theme_linedraw(base_family = 'DejaVu Sans', base_size = 4) +
  ggplot2::theme(
    plot.title = ggplot2::element_text(hjust = 0.5, size = 4.25, face = 'plain'),
    axis.ticks.length = ggplot2::unit(-1, 'pt'),
    axis.ticks = ggplot2::element_line(linewidth = 0.05),
    panel.grid.major.y = ggplot2::element_blank(),
    panel.grid.minor = ggplot2::element_blank(),
    panel.grid.major.x = ggplot2::element_line(linetype = 2),
    axis.text.x.top = ggplot2::element_blank(),
    axis.text.y.right = ggplot2::element_blank(),
    axis.title.x.top = ggplot2::element_blank(),
    axis.title.y.right = ggplot2::element_blank()
  ) +
  ggplot2::labs(
    title = 'Shots from 2016/17 & 2017/18 seasons',
    y = NULL,
    x = 'Outperformance (= G/xG)'
  )

proj_dir <- 'posts/xg-ratio-empirical-bayes'
plot_path <- file.path(proj_dir, 'shaw-figure-1-replication.png')
ggplot2::ggsave(
  adj_ratio_plot,
  filename = plot_path,
  units = 'px',
  width = 549,
  height = 640
)

orig_image <- magick::image_read(file.path(proj_dir, 'shaw-figure-1.png'))
replicated_image_with_asa_logo <- magick::image_read(plot_with_asa_logo_path)
combined_image_with_tony_logo <- magick::image_append(
  c(orig_image, replicated_image_with_tony_logo), 
  stack = TRUE
)

magick::image_write(
  combined_image_with_tony_logo, 
  path = file.path(proj_dir, 'shaw-figure-1-compared-w-tony-logo.png')
)

Beyond Replication

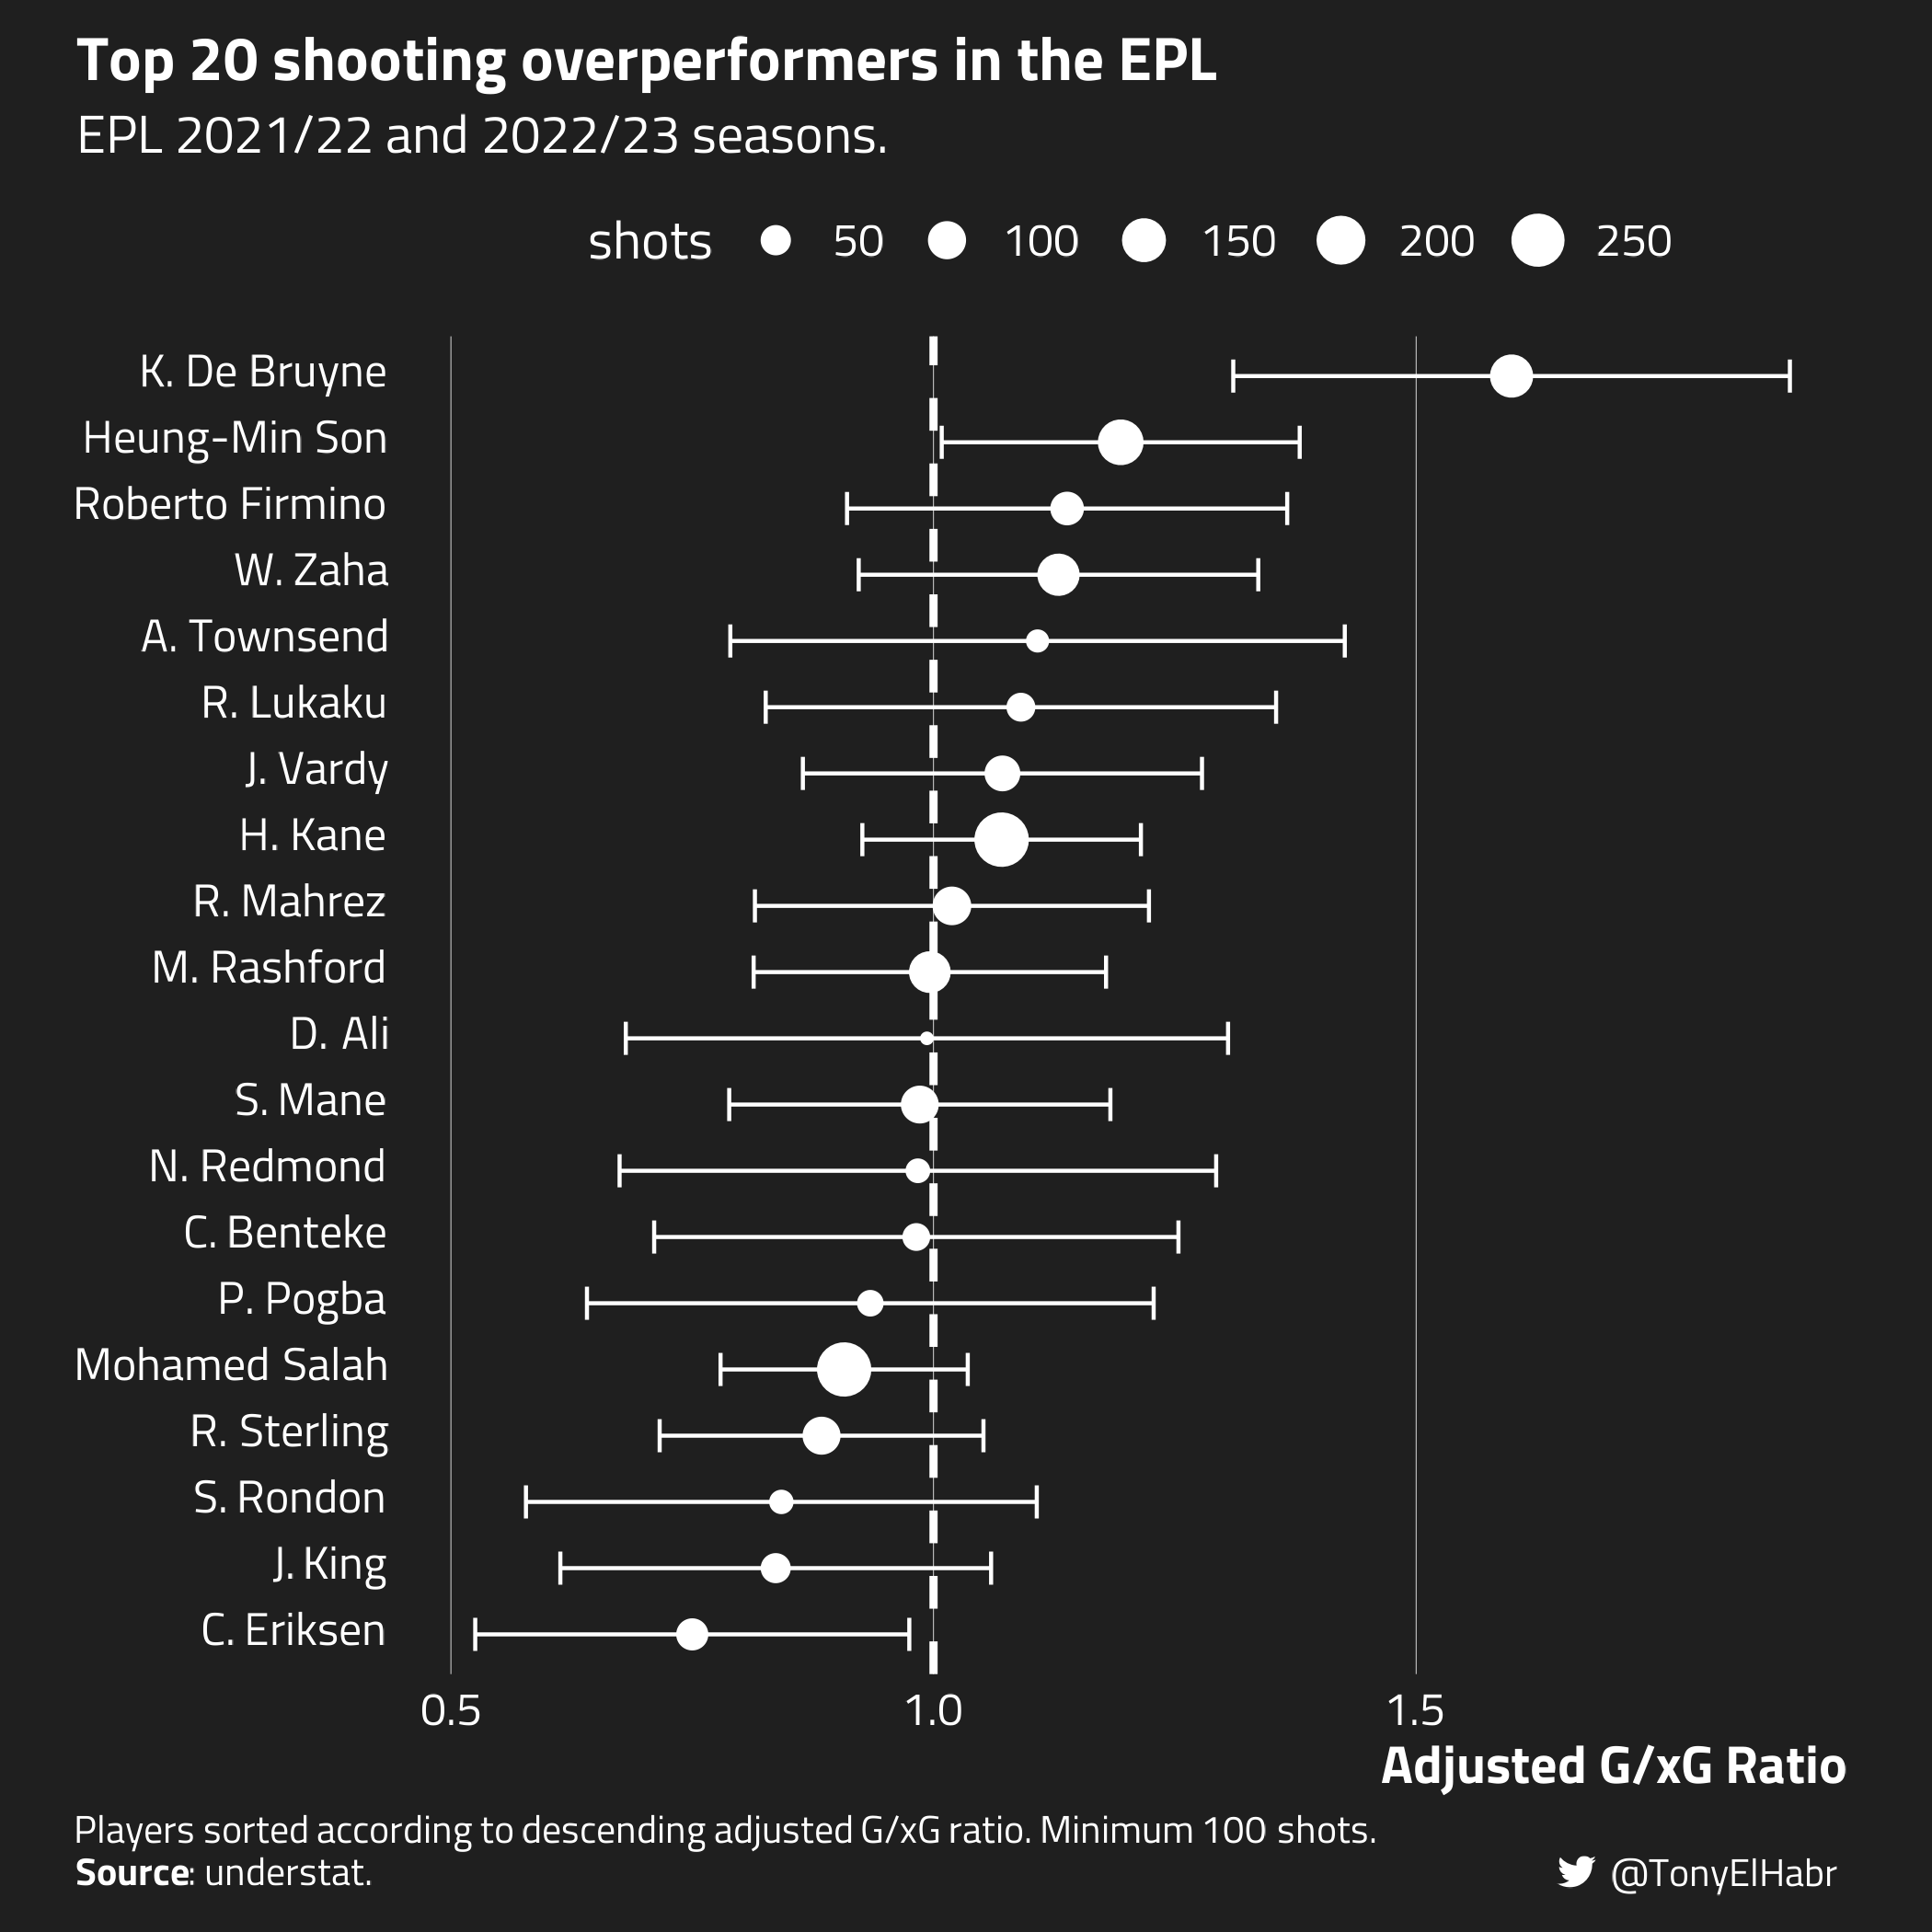
For the sake of having a pretty plot that’s not just an attempt to replicate the original, let’s run it all back, this time with EPL 2021/22 and 2022/23 data.

Code
raw_shots <- worldfootballR::load_understat_league_shots(league = 'EPL')
shots <- raw_shots |> 
  tibble::as_tibble() |> 
  dplyr::filter(
    season %in% c(2021L, 2022L),
    situation != 'DirectFreeKick'
  ) |> 
  dplyr::arrange(id) |> 
  dplyr::transmute(
    id,
    player,
    ## since 2022/23, xG is filled out, not x_g
    xg = dplyr::coalesce(x_g, xG),
    g = as.integer(result == 'Goal')
  )

shots_by_player <- shots |> 
  dplyr::group_by(player) |> 
  dplyr::summarize(
    shots = dplyr::n(),
    dplyr::across(c(g, xg), sum)
  ) |> 
  dplyr::ungroup() |> 
  dplyr::mutate(raw_ratio = g / xg) |> 
  dplyr::arrange(dplyr::desc(shots))
shots_by_player

shots_by_player$adj_ratio <- purrr::map2(
  shots_by_player$g, shots_by_player$xg,
  function(g, xg) {
    simulate_gamma_posterior(
      successes = g,
      trials = xg,
      prior_shape = prior_shape,
      prior_rate = prior_rate
    )
  }
)

adj_ratio_by_player <- shots_by_player |> 
  tidyr::unnest_wider(
    adj_ratio, 
    names_sep = '_'
  ) |> 
  dplyr::arrange(dplyr::desc(adj_ratio_mean))

ordinal_adj_ratio_by_player <- adj_ratio_by_player |>
  dplyr::filter(
    player %in% names(shaw_players)
  ) |> 
  dplyr::mutate(
    player = forcats::fct_reorder(shaw_players[player], adj_ratio_mean)
  )

library(htmltools)
library(sysfonts)
library(showtext)

blackish_background <- '#1f1f1f'
font <- 'Titillium Web'
sysfonts::font_add_google(font, font)
sysfonts::font_add('fb', 'Font Awesome 6 Brands-Regular-400.otf')
showtext::showtext_auto()
plot_resolution <- 300
showtext::showtext_opts(dpi = plot_resolution)
## https://github.com/tashapiro/tanya-data-viz/blob/1dfad735bca1a7f335969f0eafc94cf971345075/nba-shot-chart/nba-shots.R#L64

tag_lab <- htmltools::tagList(
  htmltools::tags$span(htmltools::HTML(enc2utf8("&#xf099;")), style='font-family:fb'),
  htmltools::tags$span("@TonyElHabr"),
)

beyond_replication_adj_ratio_plot <- ordinal_adj_ratio_by_player |>
  ggplot2::ggplot() +
  ggplot2::aes(y = player) +
  ggplot2::geom_vline(
    ggplot2::aes(xintercept = 1), 
    linewidth = 1.5,
    linetype = 2,
    color = 'white'
  ) +
  ggplot2::geom_errorbarh(
    ggplot2::aes(
      xmin = adj_ratio_mean - adj_ratio_sd,
      xmax = adj_ratio_mean + adj_ratio_sd
    ),
    color = 'white',
    height = 0.5
  ) +
  ggplot2::geom_point(
    ggplot2::aes(x = adj_ratio_mean, size = shots),
    color = 'white'
  ) +
  ggplot2::theme_minimal() +
  ggplot2::theme(
    text = ggplot2::element_text(family = font, color = 'white'),
    title = ggplot2::element_text(size = 14, color = 'white'),
    plot.title = ggplot2::element_text(face = 'bold', size = 16, color = 'white', hjust = 0),
    plot.title.position = 'plot',
    plot.subtitle = ggplot2::element_text(size = 14, color = 'white', hjust = 0),
    plot.margin = ggplot2::margin(10, 20, 10, 20),
    plot.caption = ggtext::element_markdown(color = 'white', hjust = 0, size = 10, face = 'plain', lineheight = 1.1),
    plot.caption.position = 'plot',
    plot.tag = ggtext::element_markdown(size = 10, color = 'white', hjust = 1),
    plot.tag.position = c(0.99, 0.01),
    panel.grid.major.y = ggplot2::element_blank(),
    panel.grid.minor.x = ggplot2::element_blank(),
    panel.grid.major.x = ggplot2::element_line(linewidth = 0.1),
    plot.background = ggplot2::element_rect(fill = blackish_background, color = blackish_background),
    panel.background = ggplot2::element_rect(fill = blackish_background, color = blackish_background),
    axis.title = ggplot2::element_text(color = 'white', size = 14, face = 'bold', hjust = 0.99),
    axis.line = ggplot2::element_blank(),
    axis.text = ggplot2::element_text(color = 'white', size = 12),
    axis.text.y = ggtext::element_markdown(),
    legend.text = ggplot2::element_text(color = 'white', size = 12),
    legend.position = 'top'
  ) +
  ggplot2::labs(
    title = 'Top 20 shooting overperformers in the EPL',
    subtitle = 'EPL 2021/22 and 2022/23 seasons. ',
    caption = 'Players sorted according to descending adjusted G/xG ratio. Minimum 100 shots.<br/>**Source**: understat.',
    y = NULL,
    x = 'Adjusted G/xG Ratio',
    tag = tag_lab
  )

beyond_replication_plot_path <- file.path(proj_dir, 'beyond-replication.png')
ggplot2::ggsave(
  beyond_replication_adj_ratio_plot,
  filename = beyond_replication_plot_path,
  width = 7,
  height = 7
)

For those who follow the EPL, The usual suspects, like Heung-Min Son, show up among the best of the best HERE. The adjusted mean minus one standard deviation value exceeds zero for Son, so one might say that he was a significantly skilled shooter over the past two season.9

Conclusion

Having not seen a very clear example of Gamma-Prior EB implementation on the internet–although there are several good explanations with toy examples such as this e-book chapter from Hyvönen and Topias Tolonen–I hope I’ve perhaps un-muddied the waters for at least one interested reader.

As for the actual application of \(G / xG\) for evaluating shooting performance, I have mixed feelings about it. Further analysis shows that it has zero year-over-year stability, i.e. one shouldn’t use a player’s raw or adjusted G/xG ratio in one season to try to predict whether their outperformance ratio will sustain in the next season. On the other hand, by simply making player estimates more comparable, the EB adjustment of \(O_p\) certainly is an improvement over raw \(G / xG\) itself.

Comparing hypothetical player A with 6 goals on 2 xG (\(O_p = 3\)) vs. player B with 120 goals on 100 xG directly (\(O_p = 1.2\)) is unfair; the former could be performing at an unsustainable rate, while the latter has demonstrated sustained overperformance over a lot more time. Indeed, applying the EB adjustment to these hypothetical numbers, player A’s \(O_p\) would be shrunken back towards 1, and player B’s adjustment would be effectively nothing, indicating that player B’s shooting performance is stronger, on average.

No matching items

Footnotes

  1. This conjugate distribution table might be handy for those curious to know which distributions are typically paired together for empirical Bayes estimation.↩︎

  2. If you’ve seen my work, you might have noticed that I’ve used Beta-Binomial EB a few times for public projects in the past:

    1. to estimate the proportion of direct free kick shots on target (soccer), grouped by league
    2. to adjust Whataburger Yelp reviews for small sample sizes
    ↩︎
  3. Note that understat maintains its own xG model, so the xG on understat won’t exactly match what you might get from Opta or StatsBomb.↩︎

  4. FBRef only provides expected goals dating back to the 2017/18 season, so unfortunately it’s not viable for this analysis.↩︎

  5. The other major reason why I may not be able to match his results is if I’ve implemented the Gamma-Poisson adjustment in a different (hopefully, not incorrect 😅) manner.↩︎

  6. In the wild, you’ll see alpha and beta used to describe the hyperparameters. shape and rate are different ways of framing these parameters.↩︎

  7. Note that this process of selecting priors is the “twist” I mentioned in the introduction that really separates empirical Bayes estimation from a traditional, full Bayesian approach. In the latter, one chooses priors for an analysis without using the data to be included in the analysis.↩︎

  8. This post isn’t meant to be about uncertainty and credible intervals for EB adjusted means, so I won’t go into it here. Loosely, one can read the interval as quantifying the bound about which we can be confident that the true estimate lands. Uncertainty intervals that overlap with 1 broadly suggest that, even though the mean estimate may look to be much greater or less than 1, we cannot say the difference is significant from the “average” (of 1).↩︎

  9. A more strict and, arguably, correct measure is a 90 or 95% credible interval to ascertain “significance”. Nonetheless, to maintain consistency with Shaw, I’m showing standard deviation.↩︎